中心近期与上海交通大学金属基复合材料国家重点实验室合作,在Scripta Materialia发表了论文Strengthening and hardening mechanisms of additively manufactured stainless steels: The role of cell sizes。
论文设计了微观力学试验来研究通过增材制造制备的奥氏体不锈钢的变形行为,该实验在块状试样中制备了包含不同尺寸位错胞的微柱,进一步对其进行力学性能测试来直接评估屈服及塑性变形过程与位错胞尺寸的相关性。论文重点研究了位错密度对增材制造不锈钢屈服强度的重要影响,对之前“强度随位错胞大小变化而变化”的观点提出了质疑和讨论。然而本研究发现,位错的形核和微柱的硬化的确是位错胞尺寸相关的,包含更细的位错胞的微柱位错更容易形核。
本篇论文是中心在粉末床选区熔合金属增材制造研究领域取得的重要进展,由科委项目“面向复杂精细结构的金属增材制造”(编号:17JC14006001)支持。
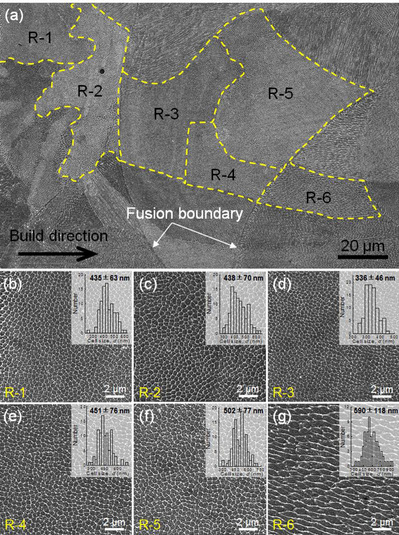
Fig. 1. (a) Cross sectional SEM image of etched AM 316L SS. Fusion boundaries were indicated by white arrows. Regions (R-1toR-6) containing various cell sizes were used for micro-pillar preparations, and were encircled by yellow dashed lines. (b)-(g) are SEM images and statistically calculated cell size distributions (insets) for regions R1 to R6, respectively. Note that the cell size of R6 was estimated from the spacing of the elongated cellular structure, which is normally believed to be the characteristic length scale associated with the cell boundary-dislocation interactions. (For interpretation of the references to colour in this figure legend, the reader is referred to the web version of this article.)
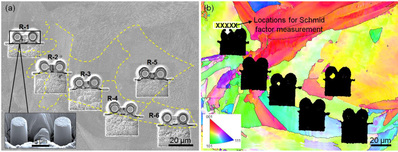
Fig. 2. (a) SEM image of the as-milled micro-pillars with the selected regions (R1-R6) superimposed. The inset shows the enlarged view of a couple of representative micro-pillars for compression test. A rectangular trench, with dimension of 30μm ×10μm ×5μm (length ×width ×depth) was milled next to the pillars to ensure a clear view of the pillars during mechanical testing. The tilt anlge was 15° during the observation. (b)The corrsponding EBSD inverse-pole figure map superimposing high-angle (grain misorientation>10°, black line) and low-angle (grain misorientation 2°−10°, white line) grain boundaries. The row of 5 crosses illustrates the locations for Schmid factor measurement of a micro-pillar in R-1.
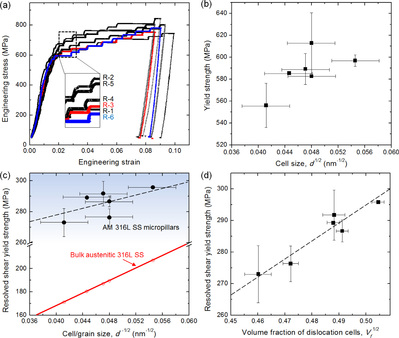
Fig. 3. (a)Representative stress-strain curves of micro-pillars containing various cell sizes. (b) Yield strength versus cell size of micro-pillars, showing their weak (if any) correlation. (c) Resolved shear yield strength versus cell size and a best linear fit of the data (dashed line). For comparison, the Hall-Petch fitting plot of bulk austenitic 316L SS is also shown. (d) A plot of resolved shear yield strength as a function of the square root of dislocation cell volume fraction ( Vf1/2). The dashed line is the best linear fit of the data.
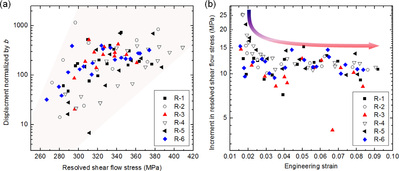
Fig. 4. (a) Statistical distribution of displacement (normalized by the Burgers vector, b ) of a discrete strain event versus the resolved shear flow stress at which it occurred, for micro-pillars containing various cell sizes. The general 'higher flow stress-larger displacement' is observed, in spite of some relatively large scattered data points (e.g. a displacement of 1150 b at the resolved shear stress of 297 MPa is included for pillars in R2). (b) A plot of shear flow strength improvement of a burst versus the strain value at which it occurs for micro-pillars with various cell sizes. The general trend is depicted by an arrow.
文献链接:https://doi.org/10.1016/j.scriptamat.2019.10.005